miVEDiX: Location, Location, Location!
I’ve written before about the concepts behind retail BI, and how the modern face of that field is changing due to innovations in the industry. Let’s dig a little deeper into that.
Back in February, Software Advice (a mobile BI reviewer) published a post from David Strom about the newest trends in location-based analytics, specifically those used in New York City during the Super Bowl:
Attendees of this year’s Super Bowl had the opportunity to stroll down Broadway in midtown Manhattan before the big game and receive personalized, location-specific shopping alerts. These alerts are made possible by mobile-enabled foot traffic technology, which retailers around the country are increasingly using as a way to better understand customer behavior and boost sales.
This is pretty cool, and it highlights some areas we’ve talked about in this blog before. The idea that location-based analytics can be used to increase sales or penetration is not a new one, but it is interesting to see it actually deployed. The Super Bowl is widely regarded as the most extravagant advertising push in America, if not the world. Millions and millions of dollars of ad revenue are spent every year on the spectacle of commercial-break and half-time advertising, and the trend shows no signs of slowing down.
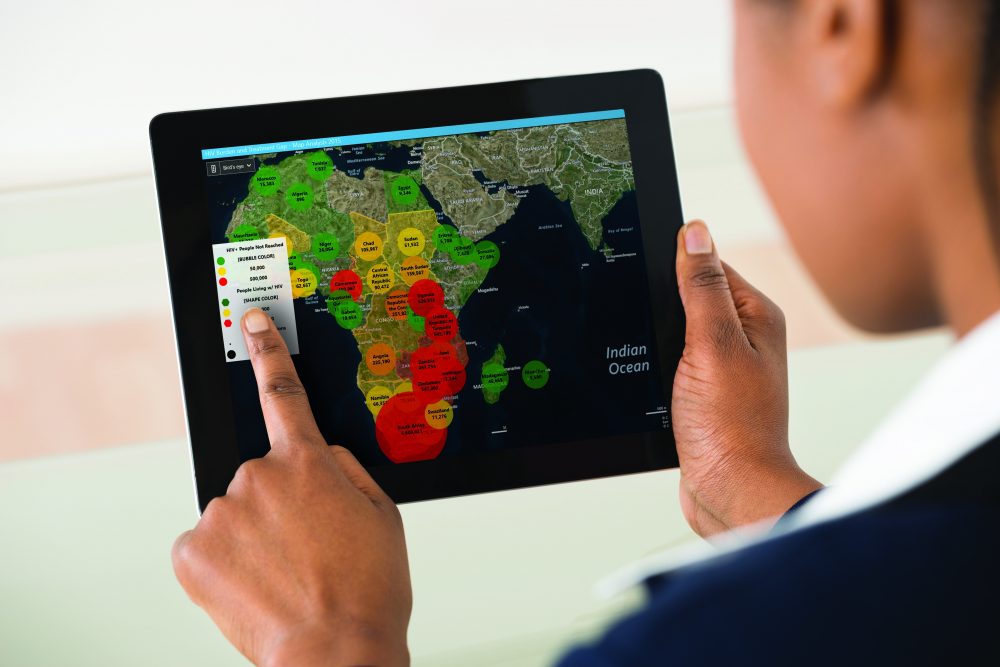
This kind of on-the-fly data collection makes me think of miVEDiX, of course. In some respects, the real-time interaction going on between the businesses in question (say, Macy’s) and the consumer looking at his/her phone, follows a parallel of how miVEDiX bridges the gap between data and device, and turns analytics into a process instead of a goal. They are both processes that are aimed at making data immediately usable, instead of a resource that just sits in a box somewhere, waiting to be pulled out and polished up.
Strom’s post also provides some helpful information on how this kind of stuff can be used for everyone in the retail business, not just those targeting Super Bowl shoppers. He writes how location-based analytics can be used to:
- Identify the Cause of Best and Worst-Performing Stores
- Use Results to Bolster Other In-Store Efforts
- Segment Your Store Into Discrete Zones for Better Analysis
Now, these are all processes you can engage in, provided you have the right software. Where these ideas become interesting to the mobile BI user is how this data can further be presented to a business person who is using a mobile product like miVEDiX. Segmenting a store into discrete zones, for example, seems like the perfect task for a real-time analytics platform. And we all know retail is not an office job — a store manager probably has little time to be sitting in front a of a computer, poring over dashboard or printouts or charts. With a platform like miVEDiX, trends can be visualized instantly, and the fast-paced style of a retail operation does not have to suffer.
So in a nutshell, what we’re seeing here is the software side of the equation meeting up with the hardware side. As the people at Software Advice know, the right software solution can make all the difference in the world when it comes to increasing profits, sales, reach, or penetration. But that software should be married to a platform that lets you exercise these capabilities in way that makes sense — hence why I’ve been plugging miVEDiX this entire blog post, which is something I normally don’t do!
It is an exciting time to be working in this business, since the hardware and platform advances being created nowadays are finally expressing the things we’ve always wanted to do with data: real-time interaction is here, and it is blast.