miVEDiX on the Big Data Landscape
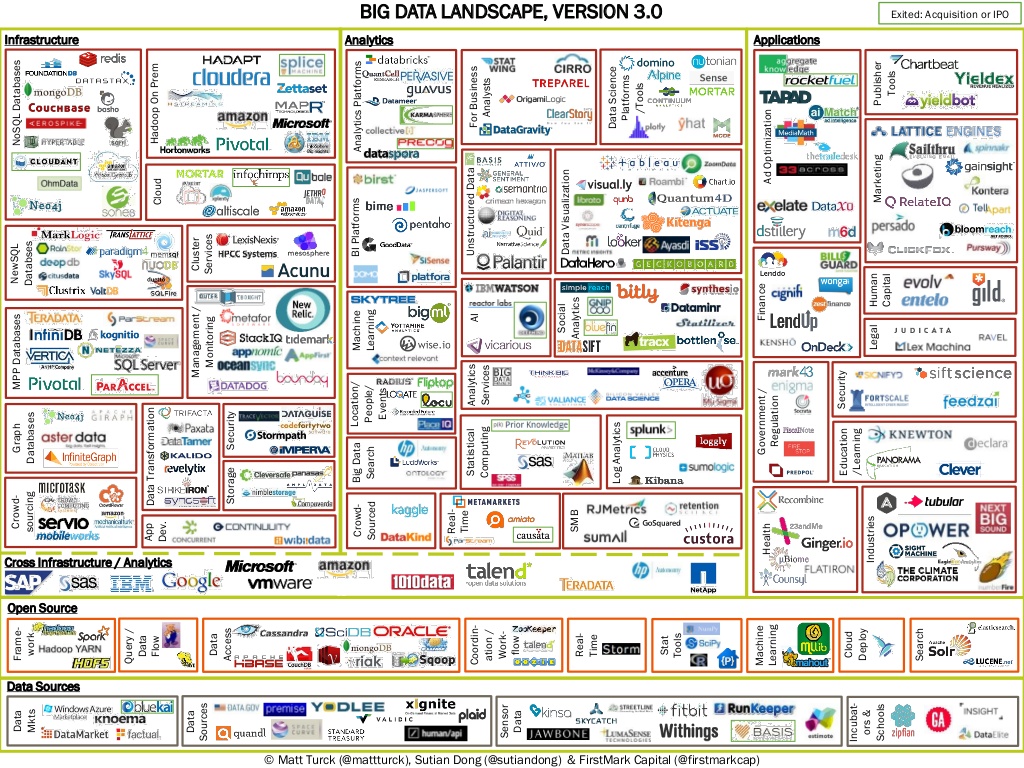
Matt Turck’s “The State of Big Data 2014” blog post — and its associated infographic — is making the rounds. Like the graphic from several years ago, Turck’s image sets the bar pretty high as far as ambition goes.

You’ll notice that he gives Analytics its own space, and we are not too humble to say that miVEDiX deserves a spot in that region (maybe next time!) because of its analytical power. As Turck writes about the category:
This has been a particularly active segment of the big data ecosystem in terms of startup and VC activity. From spreadsheet-type interfaces to timeline animations and 3D visualizations, startups offer all sorts of different analytical tools and interfaces, and the reality is that different customers will have different types of preferences, so there’s probably room for a number of vendors.
At first glance, it is easy to say that miVEDiX falls neatly into this category precisely for the characteristics that he outlines: an analytical tool that is heavy on visualizations. miVEDiX is more than just a tool, though. It is an entire platform — and here is where we might part company from Turck’s definitions.
Any attempt at categorization is going to run into edge cases where a product’s description might bleed from one category into the next. This is inevitable, and even desirable. It allows us to stretch those conceptual boundaries, and insert new (better?) wedge categories into firmly established schemes. In other words, hard-to-define concepts and products are good because they make us think. This is usually where people start describing products that are “disruptive,” and they wear that badge with pride
In this vein, miVEDiX is a terrific product to talk about because it could probably go into several of Turck’s categories. It is an analytics tool, an app, a visualization program, a BI/Big Data navigator, a real time data analytics platform . . .
And if we are inclined to focus on the “Applications” section of the graphic, I could easily suggest that miVEDiX fits into many of those categories. After all, this section of the graphic is essentially a breakdown of different products, oriented by industry. Here again, miVEDiX could easily fit into many of these industries: finance, advertising, legal, heavy industry, health, you name it.
This mixing of categories is something that Turck addresses in another post on the subject, back in March of 2012. As he points out, there’s a lot of “noise” in the Big Data/BI space as companies vie for control over their respective areas. In addition, there is a large amount of uncertainty as boutique level “science projects” either ramp up to production, or end up shrinking down (or being co-opted into other projects).
All of this throws the uniqueness of miVEDiX into sharp relief — at least, it does for me. It is not a product that is easily shunted into a specific category. It is a platform, sure, but it takes data interactivity to a different level, while providing a highly intuitive interface that non-experts can navigate and customize with ease. It is an experience that is highly visual, while of course remaining mobile.
The information provided by influencers like Mr. Turck is highly valued by industry players, because aside from all the other benefits it provides, these kinds of efforts have a remarkable ability to cut through all the nonsense. They are terrific ways to clarify what is a messy environment, what with all of the companies duking it out to win first place. So while we might be a little uneasy with the inherent vagueness in some of these categorizations, we cannot deny that they are incredibly useful.
Can you think of a BI or data product that doesn’t fit into any one category?